Low volatility equities: A closer look at the numbers
Low volatility equities provided a smoother ride through 2025’s volatile markets
Low volatility equities have long been positioned as a way to smooth the ride—particularly during market drawdowns. In 2025, they lived up to that promise, offering a buffer against tariff-driven market turbulence.
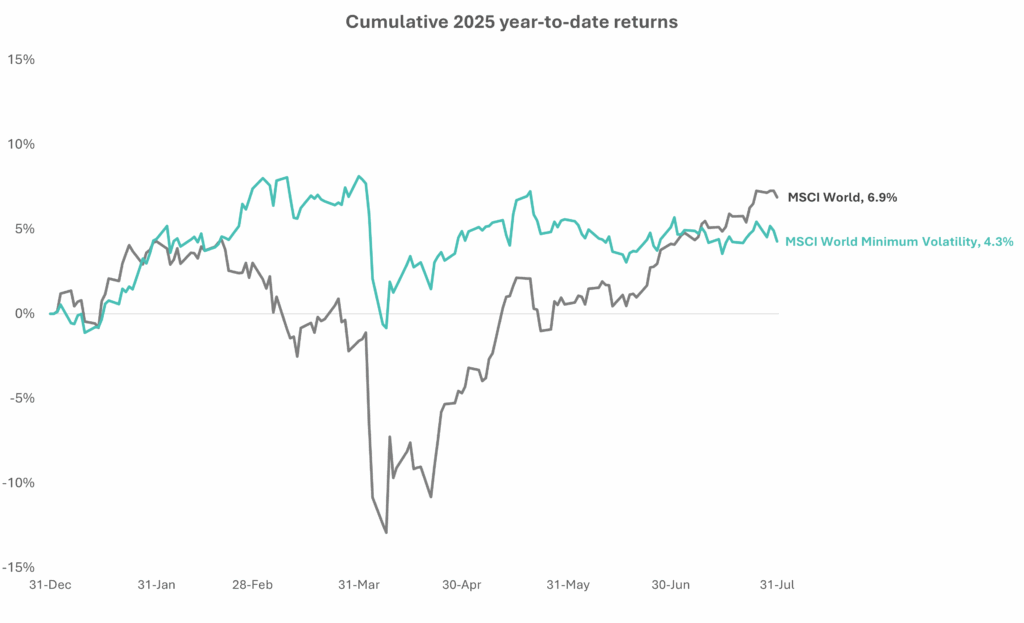
Source: LSEG Datastream. Data as of July 31, 2025.
Yet while volatility reduction has been consistent, achieving market-like returns has proven more elusive. Between July 2022 and December 2024, the MSCI World Minimum Volatility Index trailed the broader MSCI World Index by a cumulative 32%. And despite a strong start to 2025, as of July 31 the Minimum Volatility Index now trails the broad market World Index by 2.6%.
Is low volatility’s performance in 2025 a turning point, or a temporary anomaly—and do low volatility strategies still merit a place in institutional portfolios?
In this article, we examine 25 years of data to evaluate how historical performance of this asset class compares with manager claims, and outline key considerations for investors considering low volatility strategies today.
What are low volatility equities?
Low volatility equity strategies aim to deliver index-like returns over a full capital market cycle with lower volatility than the market capitalization-weighted index. But is it too good to be true? After all, a fundamental premise of financial theory is that risk and return are intrinsically linked. In an efficient market, such a ‘free lunch’ should not exist.
However, several academic studies have found empirical evidence supporting the idea that lower-volatility stocks can deliver index-like (or higher) returns. Potential explanations for this “low volatility effect” include an investor preference for more volatile stocks due to their skewed lottery-like payoffs, as well as behavioural biases that may lead some investors to overpay for riskier stocks.
Institutional interest in low volatility strategies soared following the Global Financial Crisis when low volatility equities experienced less than half the drawdown of the broader equity market. While low volatility equities lagged during the subsequent 2009 rebound, the low volatility index kept pace with the broader market in 2010 and outperformed by 13.4% in 2011. As a result, net asset inflows into low volatility strategies nearly tripled from 2010 to 2011 and continued to grow through the early 2010’s peaking at $21 billion in net inflows in 2016.
Investment managers launched a wave of low volatility strategies to meet this growing investor demand. Over 30 low volatility products were launched in 2011. You can see from the chart below that figure totals more than in the previous five years combined.
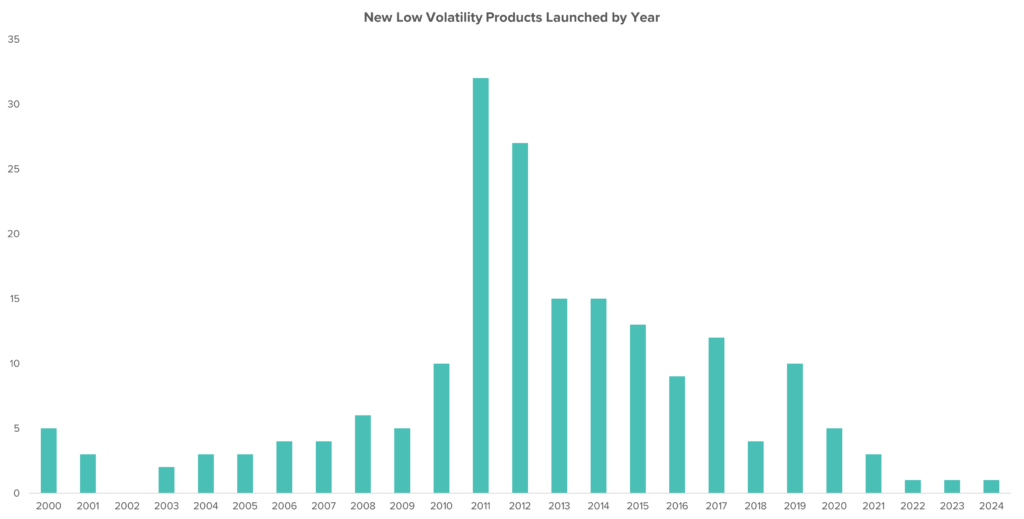
Source: eVestment ‘All Low Volatility Equity’ universe product inception dates.
Have low volatility strategies met their goals?
Low volatility strategies typically pursue a dual objective: exhibit lower volatility than the benchmark index while also delivering index-like returns over a full capital market cycle. We examine both of these objectives in further detail below.
Objective 1: Lower volatility than the benchmark index
Most strategies have succeeded on this objective. Performance of low volatility equities relative to the broad market tends to be counter-cyclical:
- Low volatility strategies tend to outperform during periods when broad market returns are negative, particularly during sharp equity market sell-offs.
- Conversely, low volatility strategies tend to underperform when broad market returns are positive, particularly during strong market rallies.
The combination of lower up-market capture and lower down-market capture has enabled low volatility strategies to deliver on their first objective of lower-than-index volatility. Over the past 25 years, the median low volatility manager in the eVestment Global Low Volatility Equity Universe has exhibited a standard deviation which is 18% lower than the MSCI World Index, on average.
However, the degree of volatility reduction has varied over time. In certain periods, such as 2007 and 2016 to 2019, the standard deviation of low volatility strategies was similar to that of the broader equity market. Notably, these were both periods when equity market volatility was near historical lows.
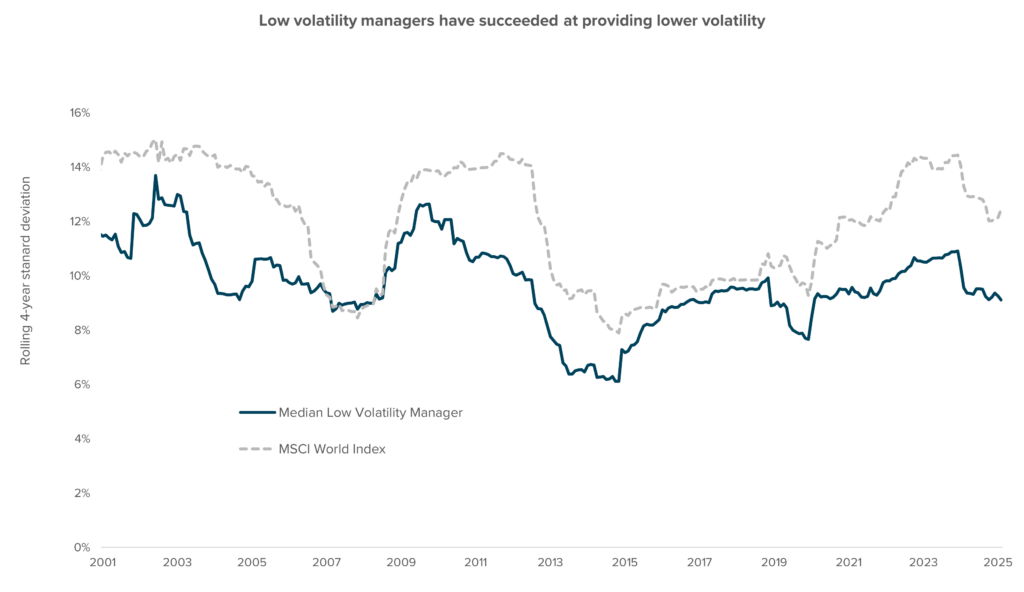
Source: eVestment Global Low Volatility Equity Universe, MSCI.
Objective 2: Index-like returns over a full capital market cycle
The track record of low volatility strategies has been more mixed when it comes to delivering index-like returns. The excess return of the median low volatility strategy relative to the index has declined over time, falling to index-relative underperformance by 2020. However, strong index-relative performance in Q1 2025 is starting to close this gap.
Based on the chart below, trends in excess return appear to be driven by the low volatility factor rather than manager skill as both top quartile and bottom quartile strategies exhibit similar patterns.
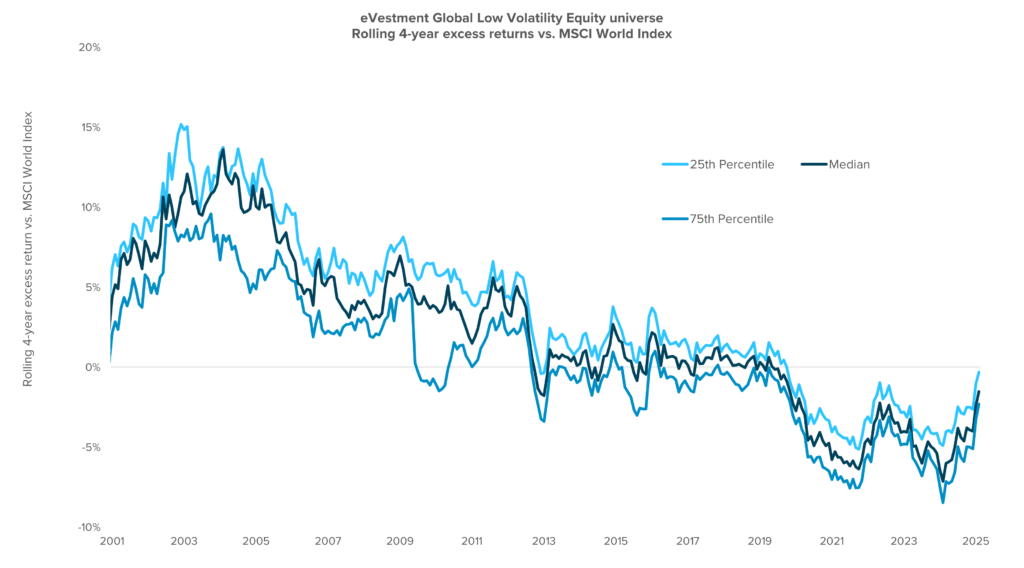
Source: eVestment, MSCI.
The overall trend in equity markets is a key factor
The ability of low volatility managers to deliver index-like returns is closely linked to the overall direction of equity markets. In positively-trending markets, where drawdowns are less frequent, low volatility strategies will struggle to match or outperform the index.
To demonstrate the strength of this correlation, the chart below plots the excess return of the median global low volatility strategy versus the percentage of negative monthly index returns over the same period.
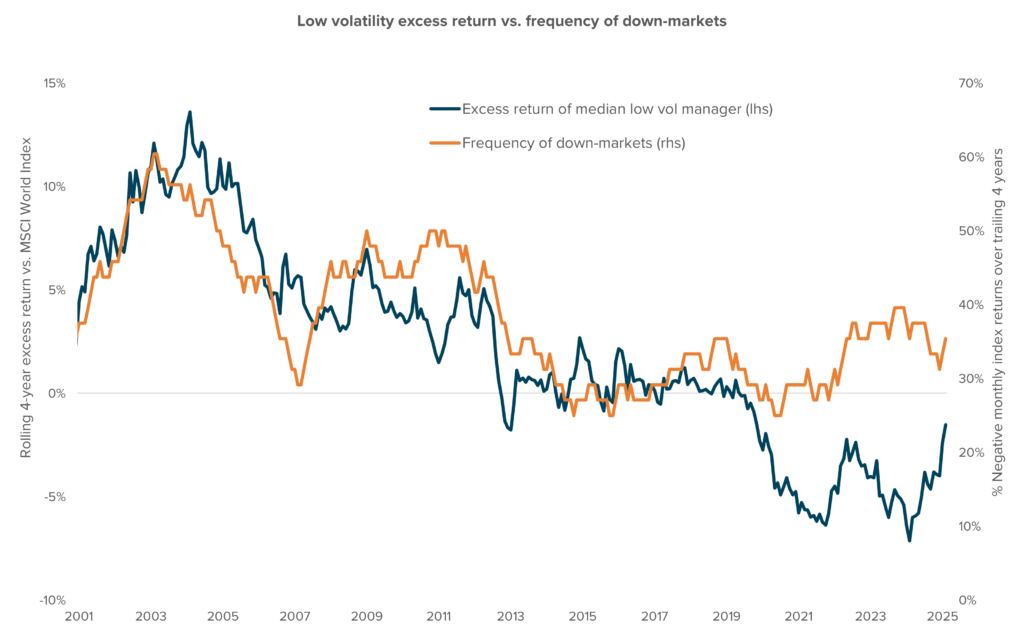
Source: eVestment Global Low Volatility Equity Universe, MSCI.
Note that the decline in excess returns experienced by low volatility strategies leading up to 2020 corresponds with a steady decline in the frequency of down markets. This correlation can be explained by the counter-cyclical performance characteristics of low volatility strategies noted earlier. Low volatility strategies typically lag the broader market during up-markets, relying on outperformance in down-markets to achieve their objective of index-like returns. If there are fewer down markets, there are fewer opportunities for low volatility strategies to counteract underperformance during up-markets.
However, as demonstrated in the divergence in this correlation post-2020, the overall trend in equity markets is not the sole factor influencing low volatility performance. Equally important is the degree to which low volatility strategies participate in market rallies and market drawdowns.
Up-market capture and down-market capture
The upside market capture ratio (UMC) is a measure of a strategy’s performance in up markets relative to the market itself. A UMC of 80% suggests that the strategy underperforms the market by 20% when markets are up during a given time period.
The downside market capture ratio (DMC) is the inverse of the UMC. A DMC of 80% suggests the strategy is down 20% less than the market when markets are negative during a given time period.
Low volatility strategies tend to exhibit UMCs and DMCs which are less than 100%, which is consistent with generally lower-than-market volatility.
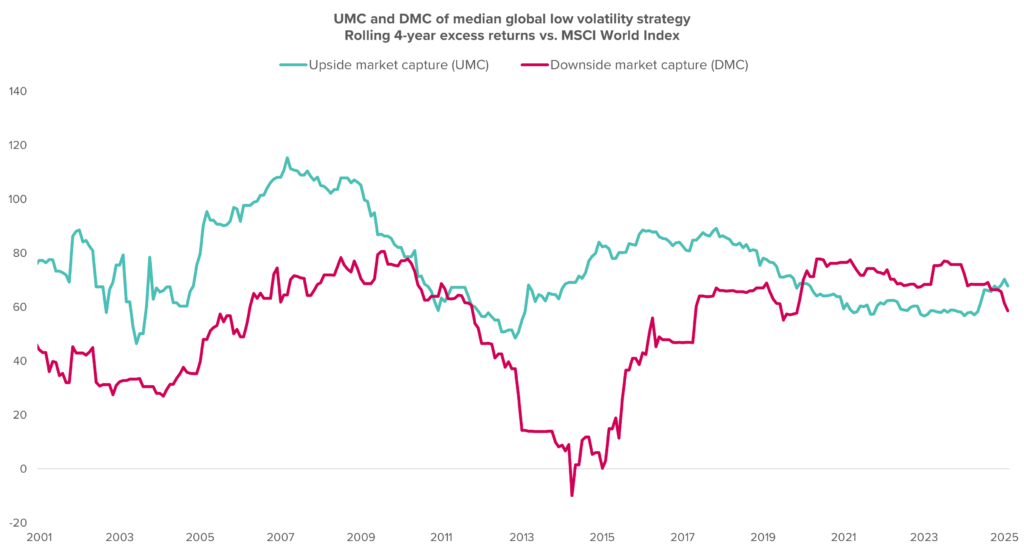
Source: eVestment Global Low Volatility Equity Universe, MSCI.
Prior to 2020, the UMC of the median global low volatility strategy was higher than the DMC. This meant that low volatility strategies captured a higher proportion of positive market returns than the proportion of market losses experienced in negative markets.
In 2020 this relationship inverted, with low volatility strategies experiencing only 61% of market gains on average, while capturing 72% of market losses. This inversion, however, ended in Fall 2024. Since this time, low volatility strategies have captured an average of 68% of market gains but only 64% of market losses.
Does a dedicated low volatility strategy make sense?
Whether low volatility strategies outperform the broader market over the next 10 years will depend on a combination of the overall market backdrop, and the up-market capture (UMC) and down-market capture (DMC) of the particular strategy.
- Overall market backdrop: If markets oscillate or trend down over the next decade, low volatility is likely to outperform. If markets climb steadily, low volatility investors will likely be disappointed. Absent a strong market conviction or crystal ball, this is a difficult factor to call.
- Up-market and down-market capture: UMC and DMC are strategy-specific characteristics which can be used to identify low volatility strategies that are likely to outperform. All else equal, a low volatility strategy with a high up-market capture (ideally near 100%) and low down-market capture (as low as possible) is most desirable. These strategies will capture most positive market returns while protecting capital during market drawdowns.
Low volatility strategies are most compelling for investors with a shorter time horizon, who prioritize the absolute stability of their portfolio over a 2-to-5-year time horizon. For these investors, low volatility strategies offer potential protection from sharp equity market drawdowns while providing some degree of upside participation in equity markets.
Considerations when choosing a low volatility manager
In addition to the usual manager selection criteria, prospective low volatility investors should consider how each manager approaches construction of their low volatility portfolio. Low volatility managers typically take one of three approaches to portfolio construction:
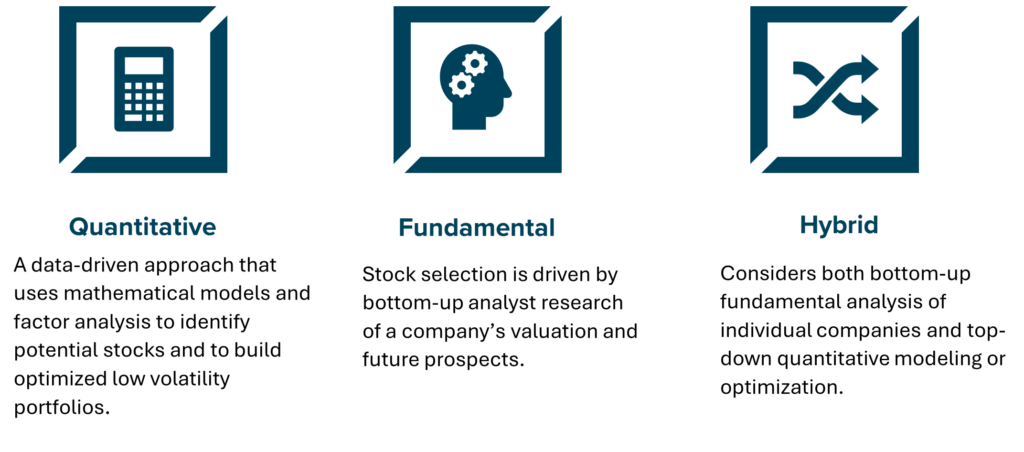
Prospective low volatility investors may also consider expanding their search to include strategies that aim to deliver absolute positive returns or which offer downside protection. These strategies often exhibit similar beta-reduction benefits as low volatility strategies, without being formerly categorized as such.
Benchmarking low volatility performance
Low volatility strategies tend to exhibit certain biases in terms of style, sector weighting and company size relative to a broad market capitalization-weighted index. For example, global low volatility equities tend to be overweight Consumer Staples, Health Care and Utilities, and underweight Technology, Consumer Discretionary and Materials as compared to the MSCI World Index. These biases can drive large benchmark-relative return differences – both positive or negative – over short- and medium-term periods.
Investors may consider using the ‘Minimum Volatility’ variant of indices, where available, to benchmark performance of low volatility strategies. Alternatively, where market-capitalization weighted benchmarks are used, investors should focus on longer-term returns when evaluating performance.